
When negotiating mergers or acquisitions, deal lawyers will often support their position by asserting that it is in accord with the “market” based on published deal points studies. However, as many of these lawyers intuit based on their experience, terms vary across the market based on a number of factors including deal size, a factor that no previously published study has examined or accounted for. This article confirms that intuition by surveying the middle market at deal sizes from several million to several billion dollars and showing, for the first time, that highly negotiated deal points tend to become more seller favorable as transaction value increases. This conclusion is based on a review of five terms (liability cap, liability basket amount and type, sellers’ catch all representations, the “no undisclosed liabilities” representation, and closing conditions) across 849 deals from 2007 to 2015, a sample larger than that used in any previously published deal points study of mergers and acquisitions.
When negotiating mergers or acquisitions, many deal lawyers try to gauge what a “market” position is for a given deal point by looking at published deal points studies.1 Often these studies are cited in negotiations by one of the parties to show that the position that party is advocating is in line with the market and thus fair. Seasoned practitioners know from experience that the other party will frequently reject the study data on grounds that it is not representative of the market segment their deal inhabits. This objection is reasonable; deal points studies provide a good baseline for understanding the market as a whole, but thus far they have not investigated how terms vary across market segments. Our study addresses one facet of that issue, perhaps the most significant one, by showing how transaction size affects highly negotiated deal points.2 By publishing, for the first time, data to show what market is at each transaction size, we hope to facilitate settlement of these contentious points and contribute to transactional efficiency.3
This study analyzes data collected from 849 merger or acquisition deals spanning nine years, from 2007 to 2015, on which SRS Acquiom served as the shareholders’ representative for a privately held target company’s shareholders.4 Through its shareholders’ representative service, SRS Acquiom is engaged when there is a large number of shareholders that would prefer to use the services of a third party to manage postclosing administration and dispute matters. In this set of 849 deals, the average number of shareholders of the private company target was 169 and the median number of shareholders was 90.5
This sample is larger than that used in any previously published study of M&A deal points and ensured that each of the six transactionsize buckets we examined contained a significant number of deals such that random outliers would not unduly skew the results. The sample reflects deals with purchase prices ranging from $1 million to $3.2 billion with a mean deal size of $149.3 million and a median of $74.5 million. This distribution focuses on deals that are sometimes referred to as the “middle market” ($10 million to $1 billion), but it also includes smaller deals under $10 million. The middle market can be further subdivided into the “lower” ($10 million to $250 million), “core” ($250 million to $500 million), and “upper” ($500 million to $1 billion) segments.6
In discussing the effect of transaction size on deal points with other deal professionals, we noted that many who have worked in multiple segments have observed that what market is varies by segment. This study demonstrates for the first time that this anecdotally observed variation of terms across deal sizes is a real phenomenon and quantifies that variation for the following negotiated terms: (I) liability caps, (II) liability basket amount and type, (III) seller’s catch-all representations and warranties, (IV) the “no undisclosed liabilities” representation, and (V) closing conditions. Our analysis shows that, in general, those highly negotiated deal points tend to become more seller favorable as deal size increases. We briefly explain each of these deal points and our findings on how transaction size affects them in the parts that follow.
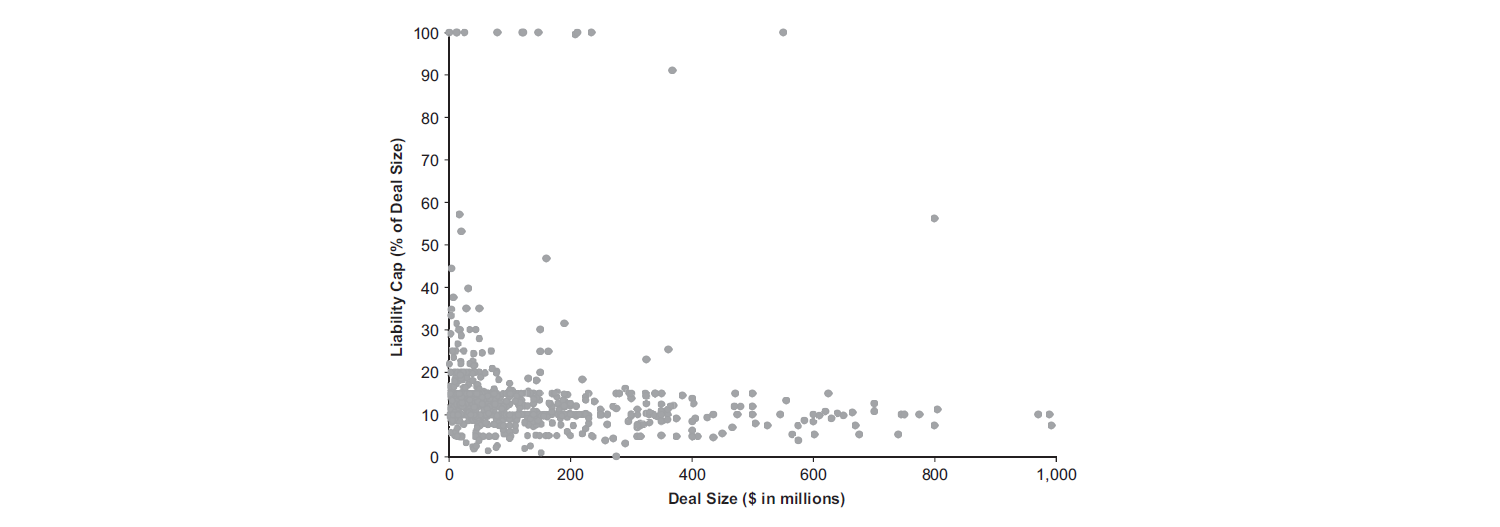
Figure 1-A
Liability Cap as a Percent of Deal Size, Versus Deal Size (Raw Data)

I. LIABILITY CAPS
Liability caps establish an upper limit on the amount of the seller’s indemnification obligations. Generally, liability caps apply to most of the seller’s representations, but they usually do not apply to covenants and representations defined by the parties to the transaction as “fundamental.”7 The seller, of course, prefers liability caps that are lower relative to the total transaction price, while the buyer prefers liability caps that are higher.
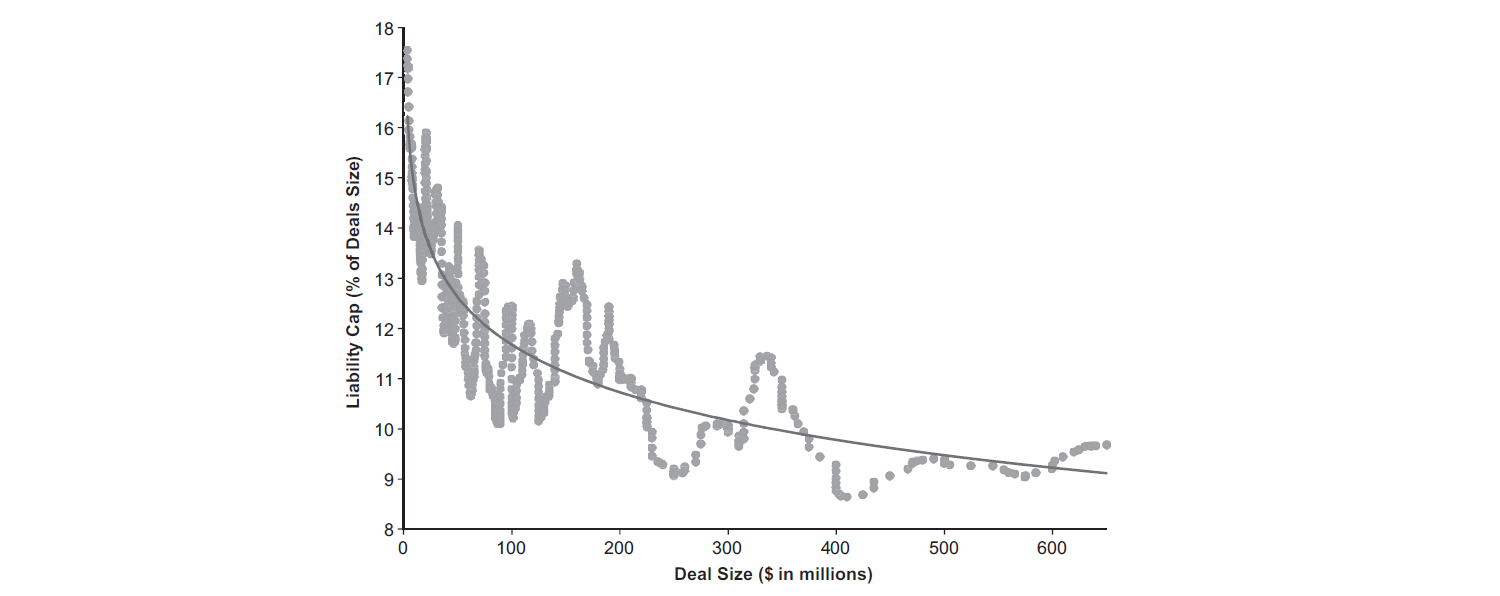
Across all deals in the sample, the mean liability cap was 14.2 percent of the transaction price. However, when looking at the relationship between liability caps and transaction size, we found that for smaller deals, buyers were able to obtain higher liability cap percentages; 74.7 percent of deals with liability caps of 20 percent or above occurred at deal sizes below the $74.5 million median of our sample (see Figure 1-A, above). To take a closer look at this nonlinear relationship, we fit an exponential decay to a mathematically smoothed set of the liability cap percentage data and found that as deals increase in size, liability caps as a percentage of the transaction size become smaller and more seller favorable (see Figure 1-B, below). This indicates that many buyers of smaller deals have the leverage to require sellers to bear more risk on a percentage basis.
Figure 1-B
Liability Cap as a Percent of Deal Size, Versus Deal Size (Smoothed Data)8

II. LIABILITY BASKET AMOUNT AND TYPE
Liability baskets establish the minimum threshold amount of the seller’s indemnification obligation below which the seller will not be liable. Like liability caps, liability baskets generally apply to most of the seller’s representations, but they usually do not apply to covenants or to fundamental representations.9 The average threshold amount of a liability basket in our study was 0.83 percent of the transaction size, decreasing slightly as the purchase price increased. A decrease in the basket amount as a percentage of deal size as deals increase in transaction size reflects a benefit for buyers, who benefit from a lower threshold (as a percentage of deal size) in bringing indemnification claims. However, basket amounts in absolute dollars still increase as deal size increases. Therefore, although a buyer’s relative position appears to be more favorable as deals become larger, the increase in the nominal basket amount still favors sellers in absolute terms. Moreover, as explained below, as transaction size increases, sellers are able to negotiate more favorable types of baskets.
In general, there are three basic types of baskets. “Deductible” baskets, which are the most seller friendly, result in liability to the seller only for damages in excess of the threshold amount. Thus, if the basket is set at $1 million and there are $1.1 million of damages, only $100,000 is recoverable against the seller. First dollar or “tipping” baskets are more buyer friendly because they result in liability to the seller for all damages once the threshold amount has been reached. For the same example, because the $1.1 million in damages is greater than the basket amount of $1 million, all $1.1 million in damages would be recoverable with a tipping basket. A third common approach is a combination or “partial tipping” basket. Under a combination basket, the seller is liable for all damages in excess of a threshold amount plus a percentage of the damages below that threshold. For example, if we again assume $1.1 million in damages but this time with a $1 million basket amount with a 50 percent tip, then the seller would be liable for $600,000 of the $1.1 million in damages (equal to the $100,000 above the threshold plus 50 percent of the amount below the $1 million threshold). Finally, in a small subset of deals, there is no liability basket, meaning that the seller is liable for all damages from the first dollar of indemnified claims, which is the most buyer-friendly alternative.
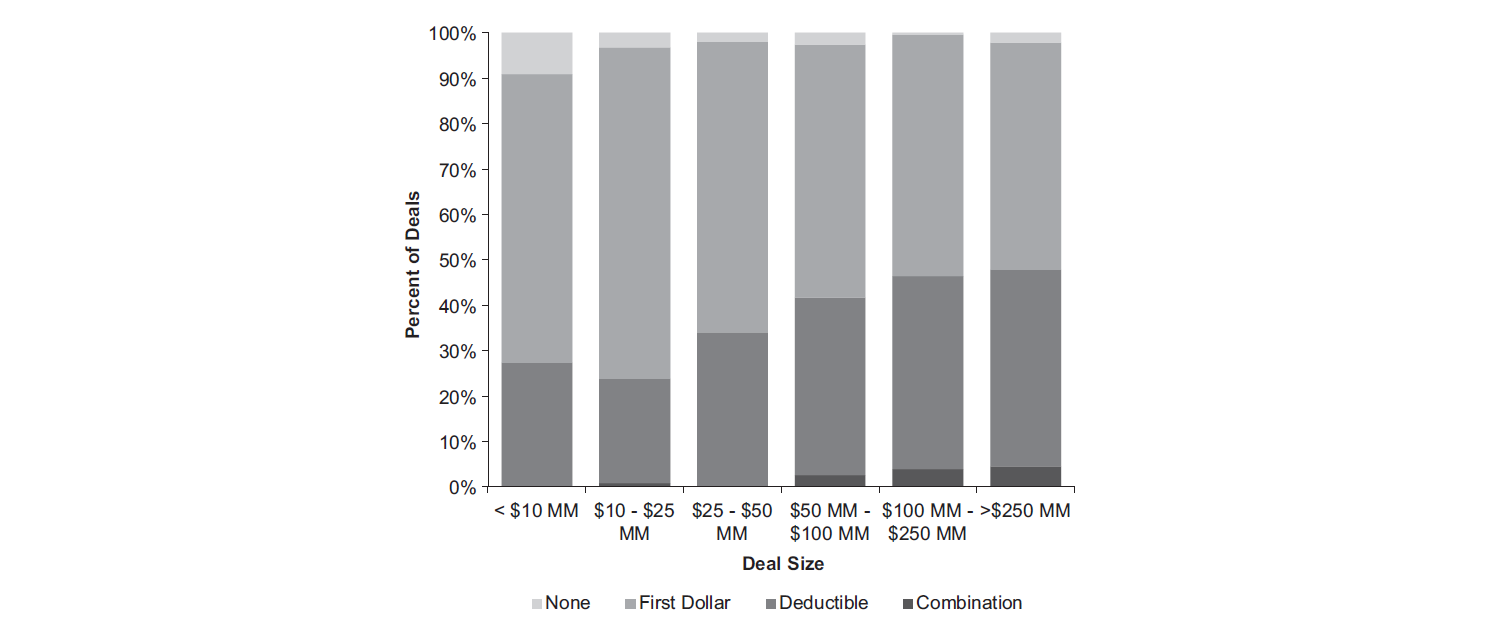
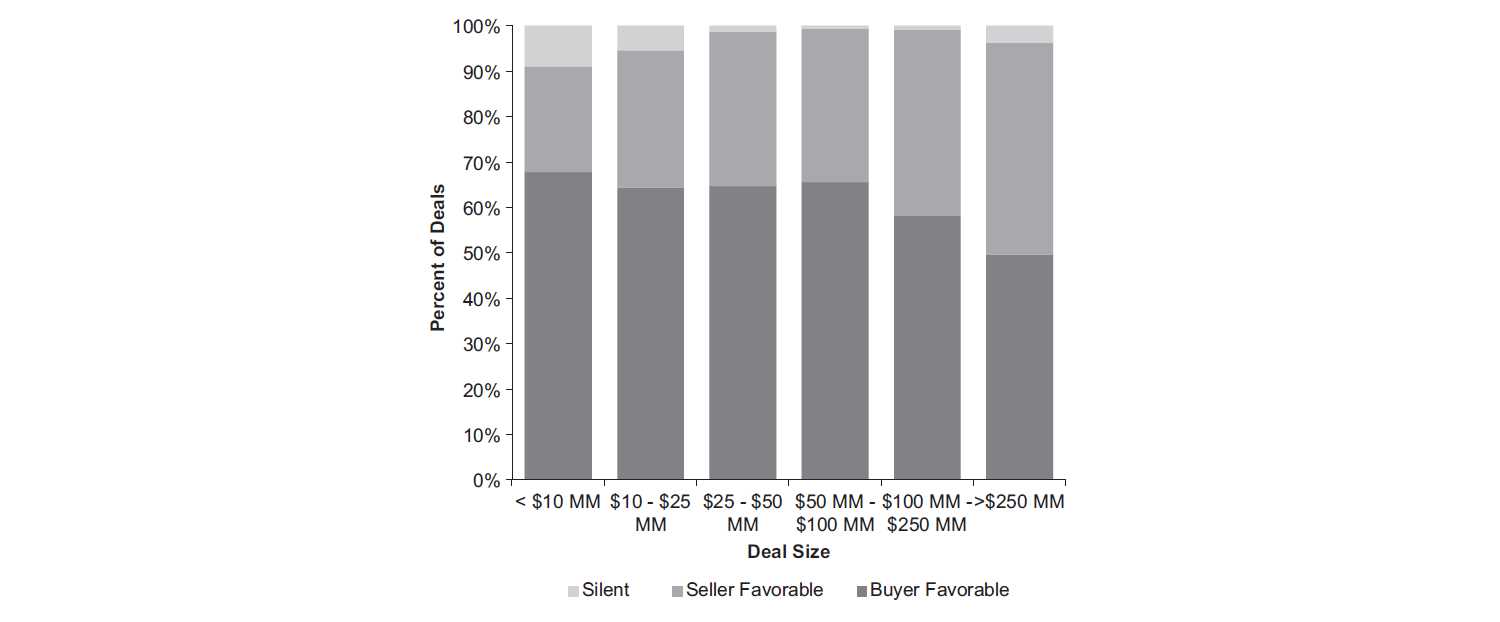
Figure 2, below, highlights the prevalence of each type of basket at various deal sizes. We note that for deals having a purchase price of less than $10 million, deals with no basket or first dollar baskets make up 72.7 percent of the deals, while deals with deductible baskets make up only 27.3 percent. As the deal size increases, so too does the prevalence of deductible or combination baskets; 47.8 percent of deals having a purchase price greater than $250 million contain deductible or combination baskets, while only 52.2 percent contain first dollar or deductible baskets. The data reflects that as deal size increases, sellers are generally able to negotiate better liability basket terms.10
Figure 2
Basket Type, Segmented by Deal Size

III. SELLER’S CATCH-ALL REPRESENTATIONS
Seller’s “catch-all” representations serve to fill in any gaps that are left by more specific representations. One common formulation, the “10b-5” representation, mirrors the Securities Exchange Act of 1934 rule of the same name, but without the scienter requirement:
No representation or warranty or other statement made by Seller in this Agreement, the Disclosure Letter, any supplement to the Disclosure Letter, the certificates delivered pursuant to Section 2.7(a) or otherwise in connection with the Contemplated Transactions contains any untrue statement or omits to state a material fact necessary to make any of them, in light of the circumstances in which it was made, not misleading.
In another formulation, the “full disclosure” representation, the seller represents that all material facts of which it has knowledge have been disclosed:
Seller does not have Knowledge of any fact that has specific application to Seller (other than general economic or industry conditions) and that may materially adversely affect the assets, business, prospects, financial condition or results of operations of Seller that has not been set forth in this Agreement or the Disclosure Letter.
Figure 3
Seller’s Catch-All Representations, Segmented by Deal Size

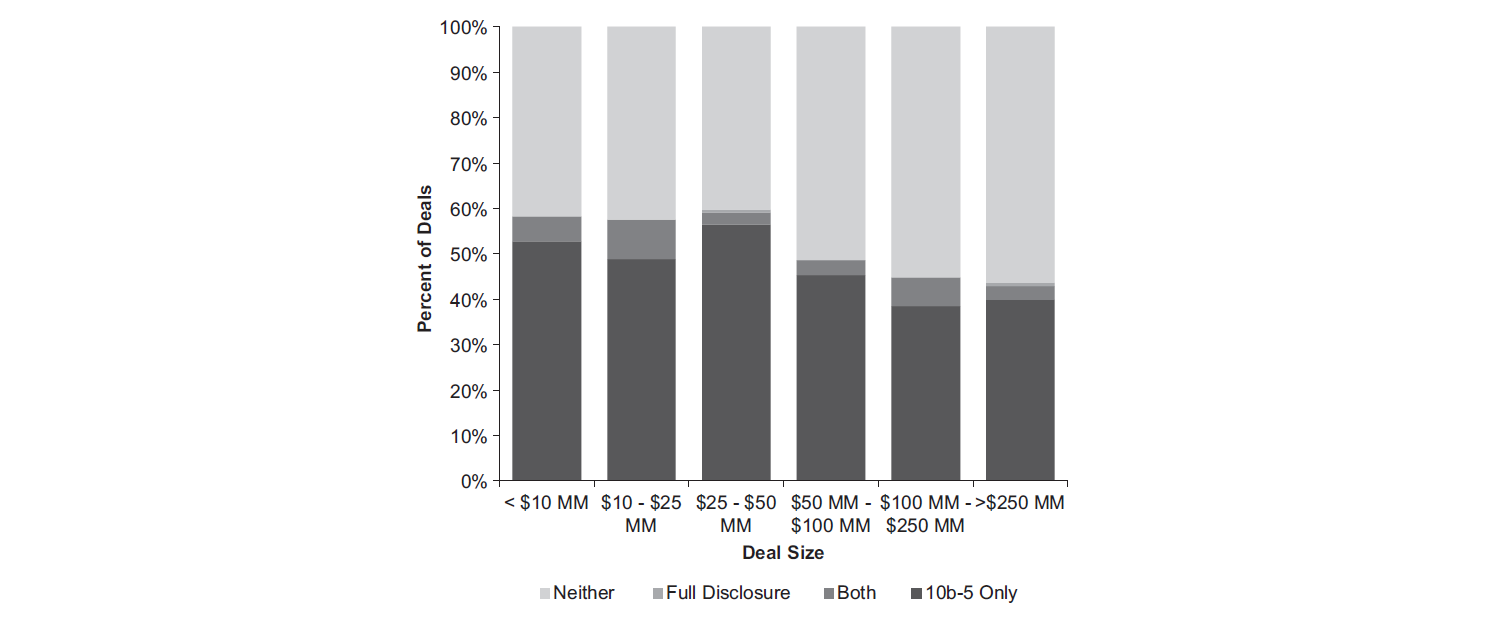
Buyers prefer to include catch-all representations because they provide a more fulsome basis for indemnification protection than do the seller’s specific representations. Conversely, sellers object to these representations because they greatly expand the potential scope of sellers’ exposure to indemnification claims.
As noted in Figure 3 above, we found that for transactions having a purchase price of less than $10 million, buyers were successful in obtaining catch-all representations in 58.2 percent of the deals in our sample. However, as the deal size increases beyond $50 million, their prevalence decreases. For deals having a purchase price greater than $250 million, only 43.6 percent of deals contain catch-all representations.11
IV. “NO UNDISCLOSED LIABILITIES” REPRESENTATION
A “no undisclosed liabilities” representation is another type of catch-all representation, designed to protect the buyer against liabilities related to the business that have not been otherwise disclosed to the buyer. Buyers prefer a blanket representation from sellers, whereas sellers prefer to omit, or at least qualify, the representation. A buyer-friendly formulation of a no undisclosed liabilities representation is as follows:
Seller has no liability except for liabilities reflected or reserved against in the Balance Sheet or the Interim Balance Sheet and current liabilities incurred in Seller’s ordinary course of business since the date of the Interim Balance Sheet.
A seller-friendly formulation would limit the representation to liabilities required to be disclosed on a balance sheet prepared in accordance with GAAP, include a Material Adverse Effect qualifier, or both:
Seller has no liability of the nature required to be disclosed in a balance sheet prepared in accordance with GAAP [or which could not reasonably be expected to have, individually or in the aggregate, a Material Adverse Effect], except for liabilities reflected or reserved against in the Balance Sheet or the Interim Balance Sheet and current liabilities incurred in Seller’s ordinary course of business since the date of the Interim Balance Sheet.
As noted in Figure 4 below, we found that the buyer-friendly formulation is most prevalent in smaller deal sizes, with 68 percent of deals having a purchase price under $10 million containing a blanket no undisclosed liabilities representation. As the deal size increases, the buyer-friendly formulation is generally less prevalent, with less than 50 percent of deals above $250 million including the formulation. Therefore, as deal size increases, sellers are increasingly able to qualify the undisclosed liabilities representation.12
V. CLOSING CONDITIONS
Prior to closing, the seller must demonstrate that certain conditions are met in order for the buyer to be obligated to close. One critical and customary closing condition is the “bring-down” of the seller’s representations. Our study reveals that there is considerable variation as to the precise standard that the seller must meet to satisfy this condition. Buyers prefer sellers to demonstrate that their representations are accurate “in all respects” as of the closing. This means that even an immaterial inaccuracy at closing in a representation that was entirely true at signing would allow the buyer not to close the transaction. An example of this formulation follows:
Figure 4
“No Undisclosed Liabilities” Representation, Segmented by Deal Size

Each of the representations and warranties made by Seller in this Agreement shall have been accurate in all respects as of the Closing Date as if made on the Closing Date.
Somewhat less buyer friendly, but still requiring the seller to bear more of the risk of changes between signing and closing, is a bring-down requiring representations to be accurate “in all material respects”; this means that only material inaccuracies in individual representations as of the closing date would allow the buyer not to close the transaction. For example:
Each of the representations and warranties made by Seller in this Agreement shall have been accurate in all material respects as of the Closing Date as if made on the Closing Date.
The most seller-friendly form of the condition, which provides the seller with the highest degree of certainty of closing, is a bring-down requiring representations to be true except for inaccuracies in the representations that would not have a “Material Adverse Effect” (as defined in the purchase agreement and commonly referred to as an “MAE”) on the business. For example:
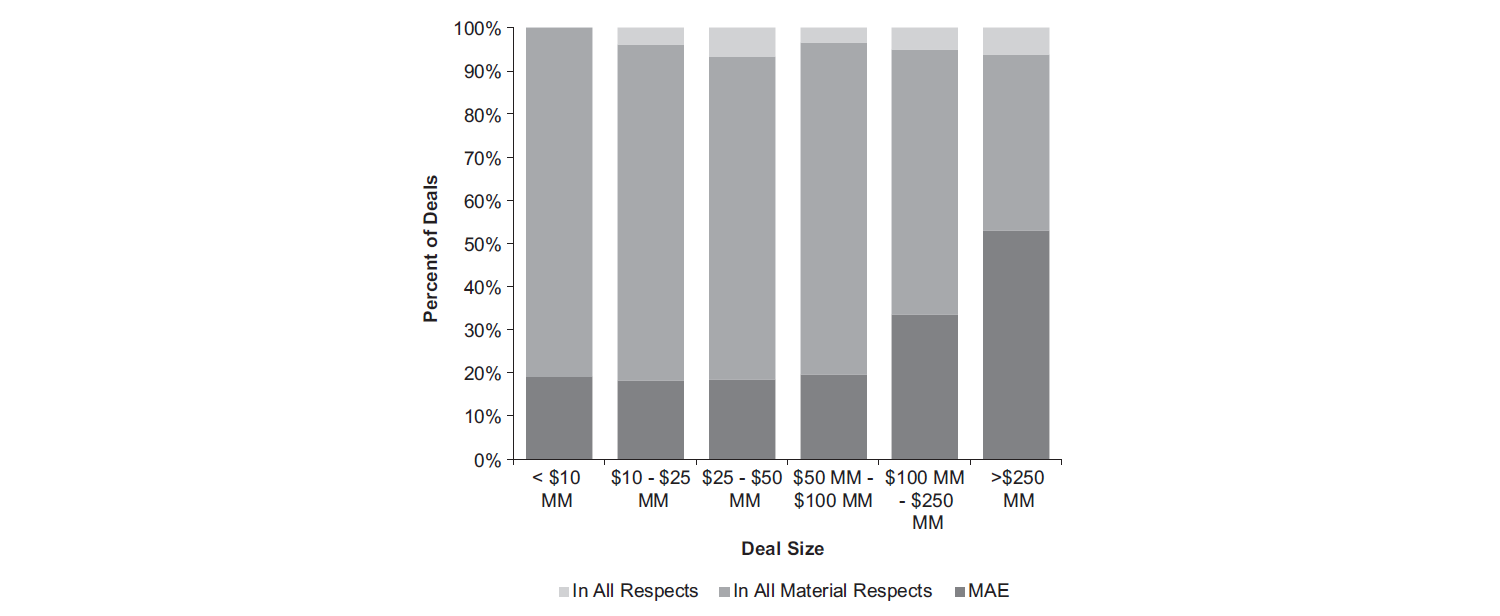
Figure 5
Closing Conditions, Segmented by Deal Size

Each of the representations and warranties made by Seller in this Agreement shall be accurate in all respects as of the Closing Date as if made on the Closing Date, except for inaccuracies of representations or warranties the circumstances giving rise to which, individually or in the aggregate, do not have and could not reasonably be expected to have a Material Adverse Effect.
As noted in Figure 5 above, only 18.4 percent of deals having a purchase price of less than $100 million have the seller-friendly Material Adverse Effect formulation. However, as purchase prices increase beyond $100 million, we found increasingly more seller-favorable formulations of the closing condition. For deals with purchase prices greater than $250 million, fully 53.1 percent of deals have the seller-favorable Material Adverse Effect formulation.13
VI. COMPARISON WITH THE 2013 AND 2015 ABA DEAL POINTS STUDIES
This is the first study to look at the prevalence of buyer- or seller-favorable deal points based on the sizes of transactions. Prior studies have tried to determine what “market” is for a given deal point by looking at the prevalence of various formulations in the study’s total sample but have not broken the sample down by transaction size.14 As a result, it is impossible to validate our results through a direct comparison with prior studies. However, by comparing the aggregate prevalence of different formulations of deal points across our entire sample with the aggregate prevalence found in prior studies, we can understand whether our sample yields similar conclusions as to what market is overall.
The most commonly cited deal points studies are the 2014 SRS Study and the 2013 and 2015 ABA Studies. The former is drawn from a subset of the data used here, and a comparison would thus not be helpful, but the ABA Studies are drawn from an entirely different sample. While the SRS Acquiom data used here come from deals in which the target company had a large number of shareholders that required the service of a shareholders’ representative, the ABA Studies look at publicly available deals that involved private targets being acquired by public companies. Despite these differences, in comparing the aggregate prevalence of the various deal point formulations seen in our study to those reported in the ABA Studies, we found that our results are consistent with those seen in the ABA Studies.
The 2013 and 2015 ABA Studies review 136 and 117 publicly available deals completed in 2012 and 2014, respectively, that involved private targets acquired by public companies through traditional merger or acquisition transactions. Compared to our sample, the ABA Studies’ samples skew toward larger deals. The value of the transactions in the 2013 ABA Study ranged from $17.2 million to $4.7 billion in purchase price (versus $1 million to $3.2 billion in this study), with mean and median deal sizes of $305 million and $150 million, respectively (versus $149 million and $74.5 million, respectively, in this study). Similarly, the value of the transactions in the 2015 ABA Study ranged from $50 million to $500 million in purchase price, with mean and median deal sizes of $186 million and $130.5 million, respectively.
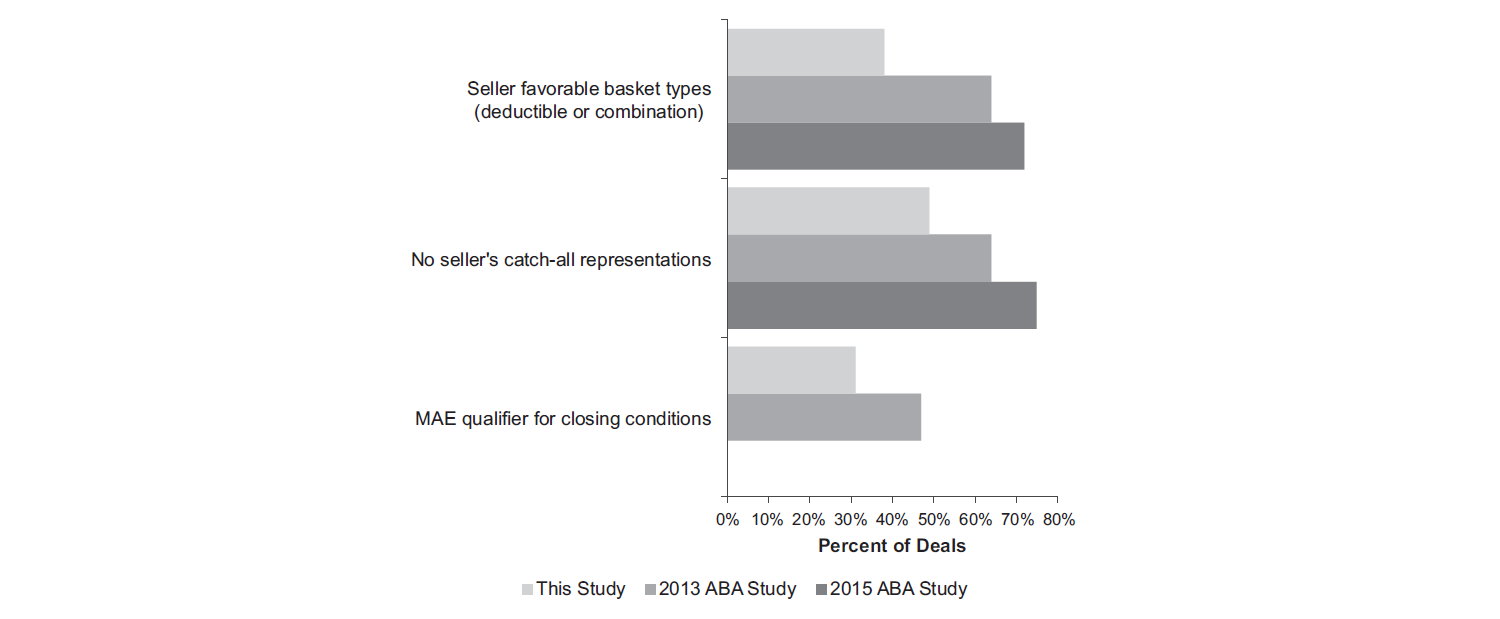
Figure 6, below, demonstrates that the deals of the ABA Studies’ samples (with their larger mean and median transaction sizes) were, on average, more seller friendly than the deals of this study with respect to liability basket type, seller’s catch-all representations, and warranties and closing condition terms.15 This is consistent with this study’s finding that the market for highly negotiated terms is more seller friendly at larger transaction sizes. Additionally, when looking at the median liability cap as a percent of deal size, the larger deals of the ABA Studies had a more seller-friendly 10.0 percent median (in both the 2013 and 2015 ABA Studies), compared with an 11.3 percent median in this study.
Figure 6
Comparison of the Percent of Deals with Seller-Friendly Terms

VII. CONCLUSION
Based on the SRS Acquiom sample, we conclude that, overall, as deals increase in transaction value, the parties become increasingly likely to settle on seller-favorable formulations of the hotly contested deal points we investigated, including liability caps, liability baskets, sellers’ catch-all representations and warranties, the “no undisclosed liabilities” representation, and closing conditions. Examining these points individually reveals that there are some instances in which deal terms do not become more seller favorable with each increase in transaction size; rather, some minor deviations in the overall trend occur.16 It is clear, however, that with respect to all of the studied points, transactions with purchase prices of less than $10 million contain, on average, more buyer-friendly terms than transactions with purchase prices above $250 million.
The reasons that legal deal terms become increasingly seller friendly as deal size increases are beyond the scope of this study. There are many possible contributing factors, and it seems likely that multiple factors play a role. Future researchers who wish to take on this question may want to start their investigations by considering the simplest explanation: a relatively weaker market for smaller businesses causes sellers of these businesses to accept more onerous legal terms just as they, on average, accept purchase prices based on lower multiples of earnings as compared to sellers of larger businesses.17 If in fact market forces are the primary contributing factor, we would expect that, within an industry, the multiples of earnings would increase as deal points become more seller favorable. Likewise, we would expect that other markers of a robust market, such as a greater number of bidders participating in an auction process,18 would correlate positively with incidence of seller-friendly deal terms.
While this study cannot explain what causes heavily negotiated deal terms to become more seller friendly as deal size increases, the trend documented here should help all parties to understand the market better and to avoid the breakdowns in negotiations that often occur when each side thinks the other is making an unreasonable or “non-market” request.
__________________
* Eric Rauch is a partner in the mergers and acquisitions practice group at Dorsey & Whitney, LLP. Brian Burke is an associate in the mergers and acquisitions practice group at Dorsey & Whitney, LLP. The authors are indebted to SRS Acquiom for offering the use of its database of M&A deals for this article, without which this study would not have been possible. Glenn Kramer of SRS Acquiom deserves special acknowledgement for his contribution to the statistical analysis included below. The authors would also like to thank John Marsalek and Bryn R. Vaaler for their thoughtful comments on earlier versions of this article. The views and opinions expressed in this article are solely those of the authors and not those of Dorsey & Whitney or of SRS Acquiom.
1. See SRS ACQUIOM, 2014 SRS ACQUIOM M&A DEAL TERMS STUDY (2014), https://www.srsacquiom.com/studies-post-type/ma-deal-terms-study/ [hereinafter 2014 SRS Study]; AM. BAR ASS’N M&A MKT. TRENDS SUBCOMM., PRIVATE TARGET MERGERS & ACQUISITIONS DEAL POINTS STUDY (2015), http://www.americanbar.org/tools/digitalassetabstract.html/content/dam/aba/administrative/business_law/deal_points/2015_private_study.pdf [hereinafter 2015 ABA Study]; AM. BAR ASS’N M&A MARKET TRENDS SUB-COMM., PRIVATE TARGET MERGERS & ACQUISITIONS DEAL POINTS STUDY (2013), http://apps.americanbar.org/buslaw/committees/CL560000/materials/matrends/2013_ABA_Private_Target.pdf [hereinafter 2013 ABA Study and, together with the 2015 ABA Study, the ABA Studies].
2. In this study, “transaction size” or “deal size” means the purchase price for the transaction, not including any earn-out consideration.
3. See Ronald J. Gilson, Value Creation by Business Lawyers: Legal Skills and Asset Pricing, 94 YALE L.J. 239 (1984) (describing the role of the business lawyer as that of a transaction cost engineer, designing efficient mechanisms to allow parties to effect transactions).
4. The set analyzed here comprises all of the merger or acquisition deals in which SRS Acquiom served as a shareholder representative from 2007 through 2015, but it excludes certain deals not considered to be traditional merger or acquisition transactions. For example, the sample does not take into account ongoing transactions with no closing date or previously completed transactions in which SRS Acquiom was engaged to take over as the successor to a different initial shareholder representative.
5. For a comparison of this sample with studies that arrived at their sample by other means, see infra Part VI.
6. See, e.g., Mary Kathleen Flynn, Private Equity Perspective: Sizing Up the Middle Market, MERGERS & ACQUISITIONS (Feb. 18, 2015), http://www.themiddlemarket.com/news/financial_sponsors/private-equity-perspective-sizing-up-the-middle-market-254816-1.html.
7. Although which representations are defined as fundamental varies by deal, one form of a pro-buyer private merger agreement offered by Practical Law Company identifies the following representations as a starting point: organization and qualification, due authority, capitalization, environmental matters, employee benefits, and broker fees. See Merger Agreement (Private Company, Pro-Buyer), PRACTICAL L., http://us.practicallaw.com/5-538-9385 (last accessed Apr. 4, 2016). In the 2014 SRS Study, representations that were identified as fundamental and carved out from liability caps more than 10% of the time included due authority (carved out 84% of the time), capitalization (78%), taxes (72%), ownership of shares (66%), due organization (62%), broker or finder fees (42%), intellectual property (31%), no conflicts (23%), employee benefits and ERISA (16%), and title to and sufficiency of assets (15%). Covenant breaches were also carved out of the liability cap 29% of the time. 2014 SRS Study, supra note 1, at 67.
8. For the smoothed data set, we ordered the deals by transaction size and convolved that with a fifteen-deal-wide triangle filter. We then fit an exponential decay to the resulting data set, obtaining the following equation of fit: Liability Cap Percent = 19.32 * exp(–0.11 * ln(Deal Size in $ Millions)). This model resulted in a residual standard of error of 0.883 on 757 degrees of freedom.
9. In the 2014 SRS Study, the following representations were carved out from the liability basket more than 10% of the time: due authority (carved out 74% of the time), capitalization (68%), taxes (64%), due organization (60%), ownership of shares (56%), broker or finder fees (42%), no conflicts (22%), intellectual property (19%), employee benefits or ERISA (17%), and title to or sufficiency of assets (14%). Covenant breaches were also carved out of the liability basket 65% of the time. 2014 SRS Study, supra note 1, at 62.
10. To determine whether the observed relationship between transaction size and basket type was meaningful, we grouped the basket types into “seller favorable” (deductible basket or partially deductible basket) and “buyer favorable” (no basket or tipping basket) and ran a Tukey honest significant difference test on the mean transaction sizes at a 95% family-wise confidence level. This test resulted in a p-value of 0.047, strongly suggesting that the data points to a relationship between transaction size and whether the basket type is buyer or seller favorable.
11. To determine whether the observed relationship between transaction size and catch-all representations was meaningful, we grouped the catch-all representations into “buyer favorable” (full disclosure, 10b-5, or both catch-all representations) and “seller favorable” (no catch-all representations) and ran a Tukey honest significant difference test on the mean transaction sizes at a 95% family-wise confidence level. This test resulted in a p-value of 0.037, strongly suggesting that the data points to a relationship between transaction size and whether a catch-all representation is included.
12. To determine whether the observed relationship between transaction size and no undisclosed liabilities representations was meaningful, we grouped the no undisclosed liabilities representations into “buyer favorable” (unqualified no undisclosed liabilities representation) and “seller favorable” (qualified no undisclosed liabilities representation or agreement silent on undisclosed liabilities) and ran a Tukey honest significant difference test on the mean transaction sizes at a 95% family-wise confidence level. This test resulted in a p-value of 0.024, strongly suggesting that the data points to a relationship between transaction size and whether the no undisclosed liabilities representation is buyer or seller favorable. Note also, however, that 8.9% of deals less than $10 million and 3.7% of deals between $10 and 25 million omit the undisclosed liabilities representation entirely, which is the most seller-favorable permutation. This is more frequent than in larger deals in our deal sample. While we cannot be certain of the reason for the apparent anomaly, it may be due to the buyer’s having addressed undisclosed liabilities through other catch-all representations.
13. To determine whether the observed relationship between transaction size and closing condition standard was meaningful, we grouped the closing condition standards into “buyer favorable” (bring-down in all respects or in all material respects) and “seller favorable” (bring-down qualified by Material Adverse Effect formulation) and ran a Tukey honest significant difference test on the mean transaction sizes at a 95% family-wise confidence level. This test resulted in a p-value of 0, reflecting a complete separation of the groups at the 95% confidence interval and indicating a very strong relationship between buyer- or seller-favorable formulations of closing condition standards and transaction size.
14. See supra note 1.
15. Note that the 2013 and 2015 ABA Studies’ categorization of the no undisclosed liabilities representation data and the 2015 ABA Study’s categorization of the closing conditions data differ from that used in our sample such that a comparison of results on those terms was not possible.
16. See, for example, Figure 2, which demonstrates that while the percentage of deals with deductible baskets generally increases as transaction size does, this percentage actually dips from 27% of deals under $10 million to only 23% of deals in the $10–25 million bucket before increasing to 34% of deals in the $25–50 million bucket.
17. See Are Valuations Commoditizing?, GF DATA RESOURCES (Feb. 5, 2015), https://www.gfdataresources.com/are-valuations-commoditizing/ (with tables showing the decrease in EBITDA multiples as deal size decreases).
18. This is especially the case because, in such processes, bidders often submit proposed revisions to the seller’s form of agreement. This allows the seller to select among bidders offering comparable valuations and choose the one that will accept the most seller-friendly legal terms.
