Economists have long argued that economic activity influences businesses filing for bankruptcy. This relationship is grounded in the simple idea that economic downturns can sufficiently reduce liquidity such that debtors are unable to meet debt obligations as they become due and might require court-driven solutions.[1]
Indeed, in the past two years a lengthy list of companies filed for bankruptcy in a wide array of industries, including: retail, commercial real estate, leisure and travel, air travel, restaurant and food service, energy, and communications.[2]
Filings and Economic Activity
To illustrate the relationship between bankruptcy filings and economic activity, one can observe bankruptcy filings over the business cycle. The two Figures below show the seasonally adjusted number of Chapter 7 and Chapter 11 filings (two common forms of bankruptcy) and an index of economic activity published by the Federal Reserve.[3]
Figure 1: Business Chapter 7 Filings and Coincident Economic Activity Index
2013 ̶ Sep 2021
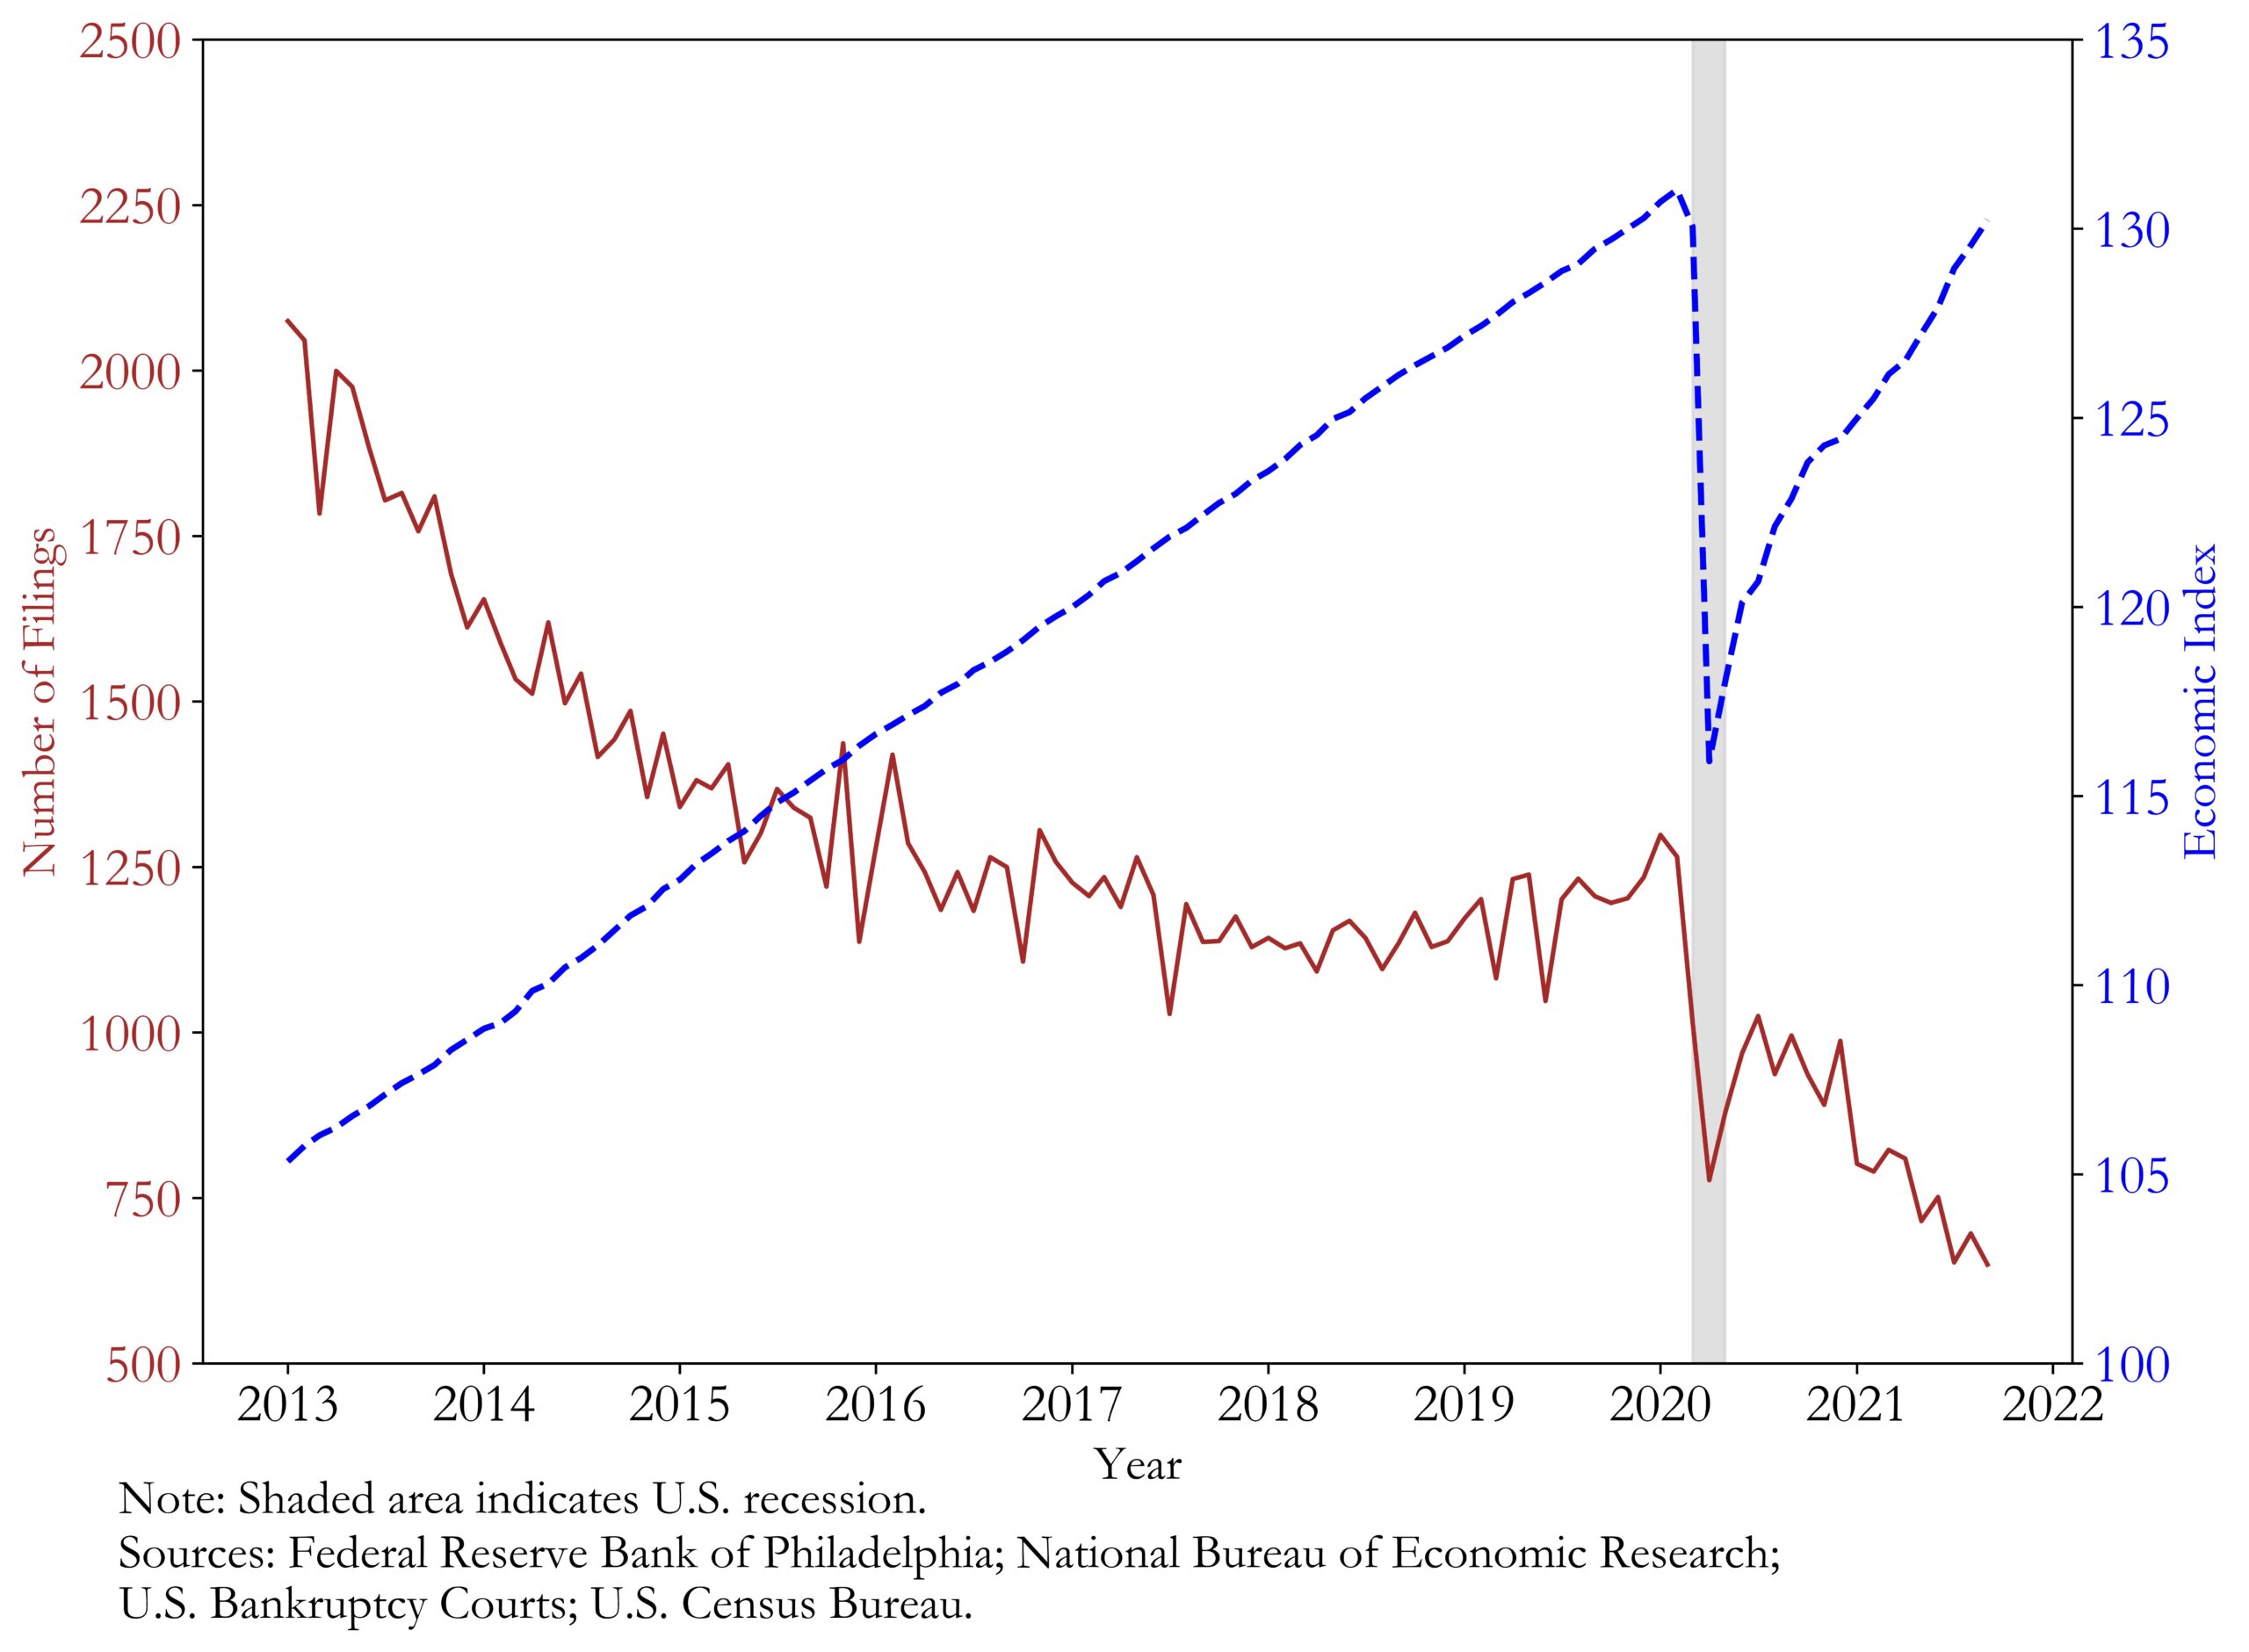
Figure 2: Business Chapter 11 Filings and Coincident Economic Activity Index
2013 ̶ Sep 2021
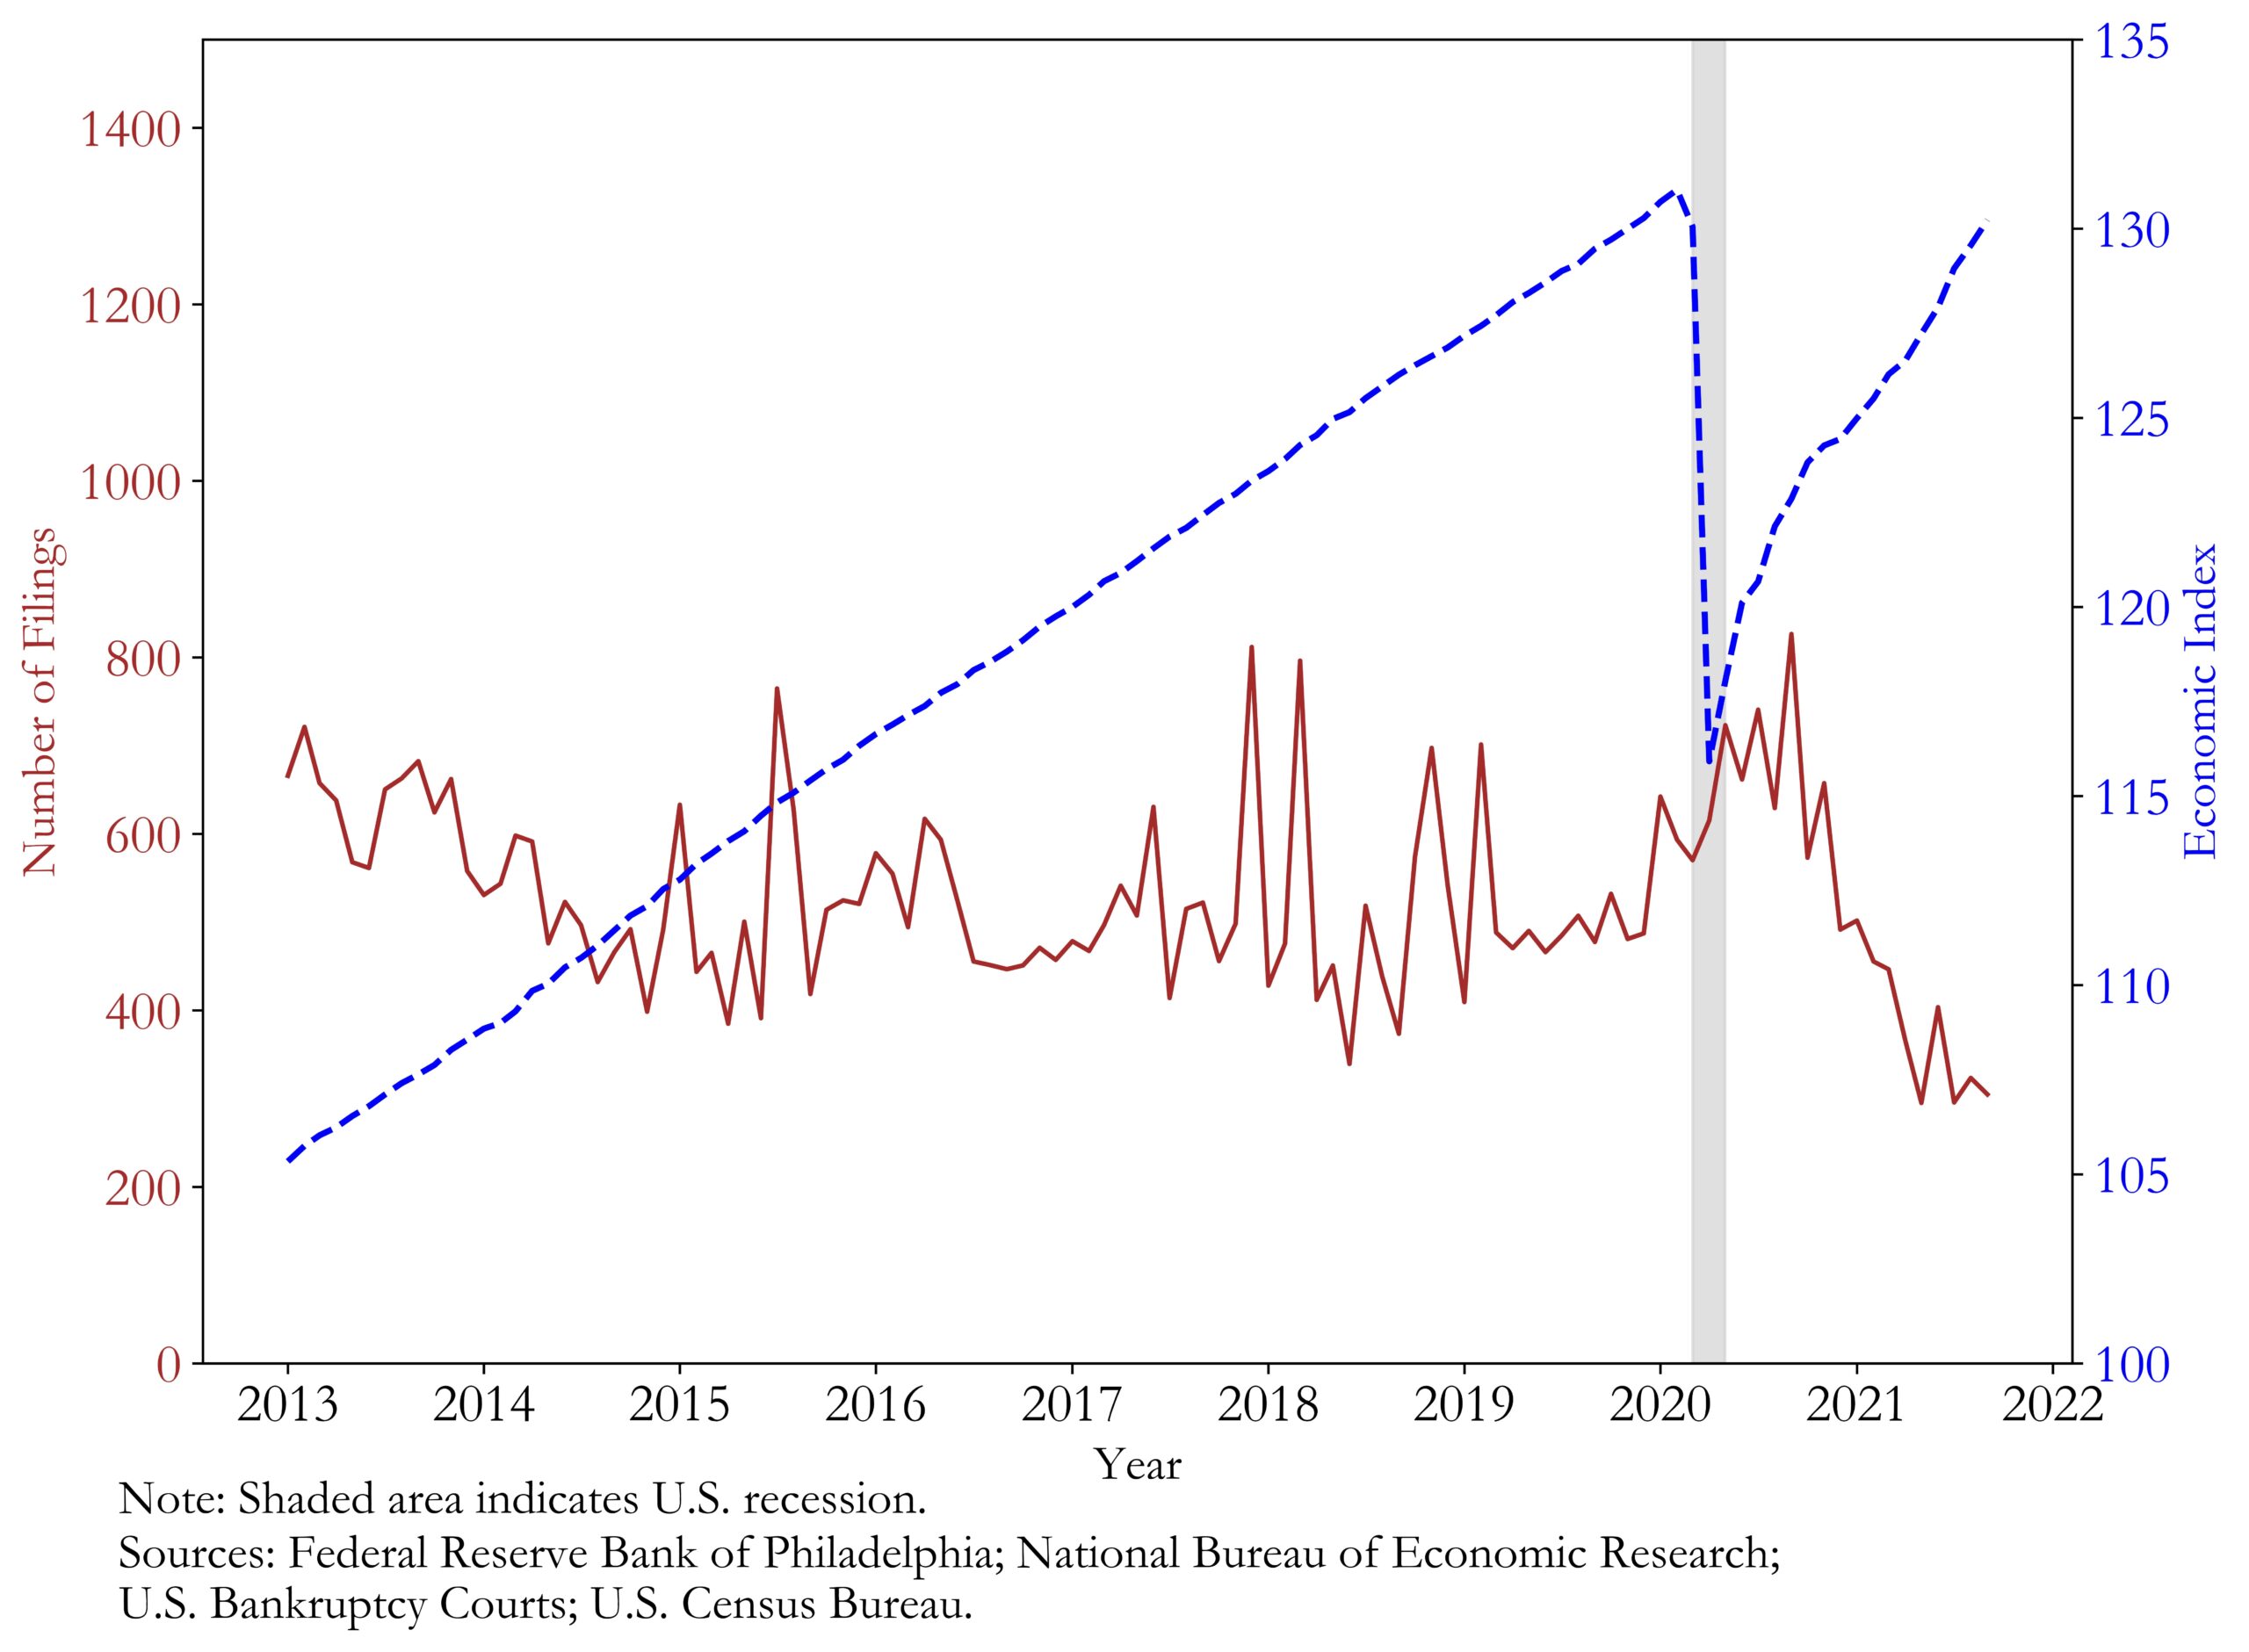
Both Figures show that up until the start of the COVID-19 recession, the continued expansion of economic activity generally corresponded with a reduction in filings for Chapter 7 and Chapter 11. In other words, there is an inverse relationship between the number of filings and the level of economic activity. But Figure 1 also illustrates that the economic contraction in 2020 corresponded with a sharp decline in Chapter 7 filings, rather than the increase in filings predicted by the historic relationship between the two indicators. Business Chapter 11 filings, on the other hand, increased even if not as much as the historical relationship would indicate.
Therefore, these Figures pose a relevant question: Has the most recent economic downturn been associated with levels of bankruptcy filings similar to those in the past? And, if the number of filings didn’t follow the historical pattern, what can explain the new trend?
Recent Filing Rates
To help answer these questions, we next compare monthly filings in each of 2020 and 2021 to those that occurred during the same month of 2019. This comparison should help control for factors other than the COVID-19 recession. We also break down bankruptcy filings into business and non-business Chapter 7 and business Chapter 11.
Figure 3: Business and Non-Business Bankruptcy Filings
2020 ̶ Sep 2021 (Benchmark Year = 2019)
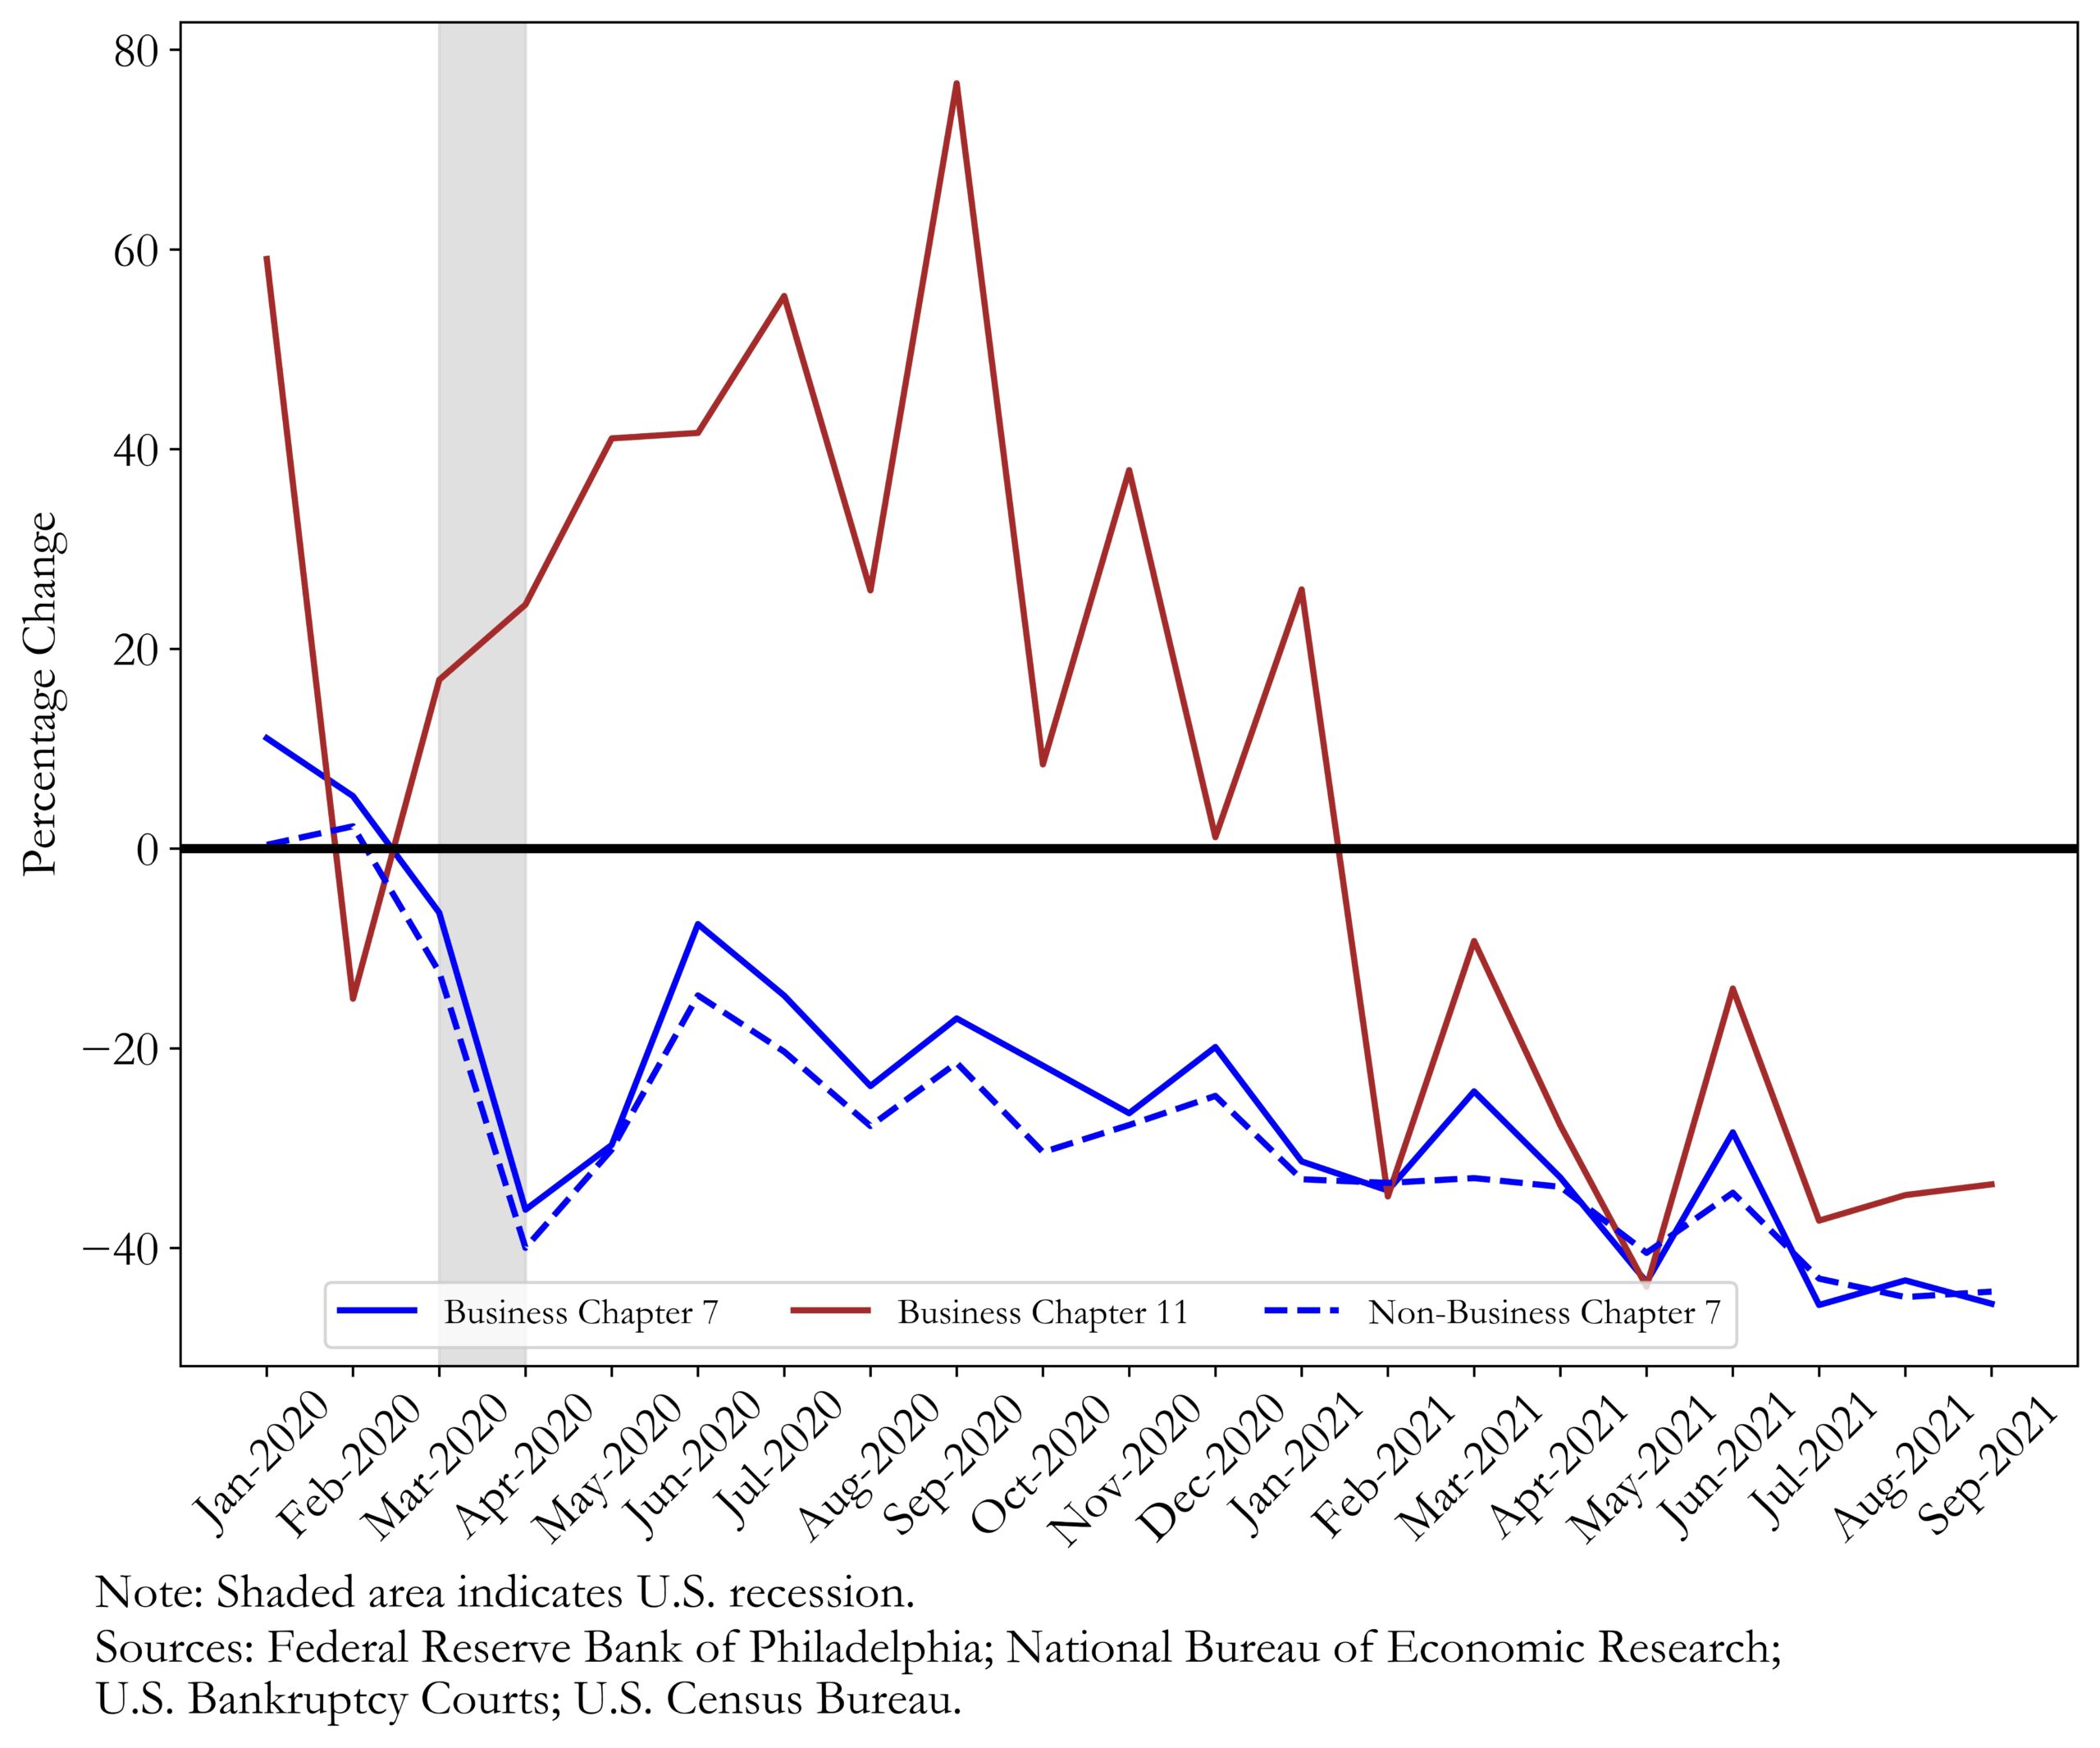
Confirming the pattern presented above, Figure 3 shows that both non-business and business Chapter 7 filings (which tend to be associated with small-to-medium size companies) were down in 2020, compared to 2019. And the number of cases did not reach the 2019 levels in the first three quarters of 2021 either. In contrast, Chapter 11 filings were significantly higher in 2020, compared to 2019. However, this trend reverted in 2021 with filings on average 28% lower than 2019 levels.
Hypotheses and Explanations
A group of economists have analyzed the rate of bankruptcy filings during 2020 in deeper detail and found comparable results. They further reported, for example, that filings by companies with asset value greater than $50 million increased by nearly 200% in 2020.[4]
As shown in Figure 3, small-to-medium businesses (and households) have filed for bankruptcy less frequently than what might have been expected. The economists provide a list of potential reasons why this might have happened, including: policy responses, access to bankruptcy courts, liquidity, and uncertainty. We explain these factors next.
The first factor refers to policy responses which might have contributed to differing filing rates among different economic actors. Policy responses such as the Coronavirus Aid, Relief, and Economic Security Act (“CARES Act”) (which included a foreclosure moratorium), the Paycheck Protection Program (“PPP”), and other measures activated by state and local governments reduced the demand for bankruptcy protection among households and smaller businesses.[5] To the extent these policies targeted smaller business and households, this factor would explain the decline in their filing rate. On the other hand, the CARES Act expanded on a new law that streamlined the Chapter 11 process (the Small Business Reorganization Act (“SBRA”)).[6] Specifically, the CARES Act raised the debt threshold required to take advantage of the streamlined Chapter 11 process envisioned under the SBRA, allowing for a larger pool of eligible companies. This could explain part of the observed increase in Chapter 11 filings.[7]
Second, households and smaller businesses may have had trouble accessing bankruptcy courts—and meeting with any bankruptcy counsel they might have retained—because of pandemic-induced changes in court operations. More difficult access to bankruptcy courts would naturally translate into less filings.[8] A related factor is that busier courts could have hindered small companies’ opportunity to file. A study shows that as bankruptcy courts see higher caseloads, the focus shifts towards larger companies at the expense of smaller ones.[9]
Third, economists have found that the existence of bankruptcy fees generally prevents households from filing. For example, a study using data from 2001 and 2008 tax rebates found that consumers who received a tax rebate increased their propensity to file for bankruptcy compared to those that did not.[10] This theory would suggest that if households or smaller businesses had constrained liquidity during the COVID-19 recession, they would have been less likely to file bankruptcy. On the other hand, an increase in liquidity would correspond to an increase in filings. This theory would be consistent with the increase in Chapter 7 filings immediately following April 2020, when the first stimulus check was distributed (and the PPP bill was signed). However, an increase in filings is not apparent after the stimulus checks distributed in December 2020 and March 2021, respectively.[11]
Lastly, the uncertainty surrounding the COVID-19 pandemic may have contributed to the slower household bankruptcy filing rates. Because households typically must wait 8 years before they can file for Chapter 7 a second time, economists argue that there is a benefit to waiting and seeing how pervasive an economic crisis is before filing for bankruptcy.[12] For businesses, a wait-and-see policy is likely more valuable for Chapter 7 compared to Chapter 11 because the former implies liquidating assets whereas the latter is often a reorganization of the business. This hypothesis explains the lower filing rates experienced by households and smaller businesses but would also predict an increase in these filings when (and if) COVID-related uncertainty dissipates, everything else being equal. A look at Figure 3 indicates that if this hypothesis is true, uncertainty remained high during the period we collected data for.
Conclusion
In summary, while economic research continues to produce insights into the broad implications of the COVID-19 pandemic, this article highlighted that COVID-related effects on bankruptcy filings by households and small businesses were different than the effects on larger companies, at least in 2020. The 2021 data indicates that this difference has largely disappeared even though filings for bankruptcy remain lower than 2019 levels. Further statistical analysis can provide clues as to the importance of the potential causes for the trends explained in this article.
For example, seminal work by Prof. Altman showed that bankruptcy can be predicted by financial ratios such as working capital to total assets, retained earnings to total assets, EBIT to total assets, market equity to total liabilities, and sales to total assets. See Edward Altman, “Financial Ratios, Discriminant Analysis and the Prediction of Corporate Bankruptcy,” Journal of Finance 23, 1968, pp. 589–609. ↑
A partial list of corresponding companies includes J.C. Penney, Neiman Marcus, Lord & Taylor, Pennsylvania Real Estate Investment Trust, Hertz, LATAM, Sizzler, Chesapeake Energy, Diamond Offshore Drilling, and Frontier. ↑
See Federal Reserve Bank of Philadelphia, Coincident Economic Activity Index for the United States [USPHCI], retrieved from FRED, Federal Reserve Bank of St. Louis. Available at http://fred.stlouisfed.org/series/USPHCI. ↑
Jialan Wang, Jeyul Yang, Ben Iverson, and Renhao Jiang, “Bankruptcy and the COVID-19 Crisis,” Working Paper, March 2021. ↑
Robin Greenwood, Ben Iverson, and David Thesmar, “Sizing Up Corporate Restructuring in the Covid Crisis,” Brookings Papers on Economic Activity, Fall 2020 (Special Edition): 391-428. See also, Alan Hochheiser, “Consumer Bankruptcy in the Age of COVID-19,” Business Law Today, American Bar Association, June 25, 2021. ↑
Lei Lei Wang Ekvall, and Timothy Evanston, “The Small Business Reorganization Act: Big Changes for Small Businesses,” Business Law Today (February 2020). Available at https://www.americanbar.org/groups/business_law/publications/blt/2020/02/small-business-reorg/. ↑
Sands Anderson, “The New Small Business Reorganization Act Comes with New Forms and Rules,” May 27, 2020. Available at https://www.jdsupra.com/legalnews/the-new-small-business-reorganization-20197/ . ↑
Paige Marta Skiba, Dalie Jimenez, Michelle McKinnon Miller, Pamela Foohey, and Sara Sternberg Greene, “Bankruptcy Courts Ill-Prepared for Tsunami of People Going Broke from Coronavirus Shutdown,” The Conversation, May 2020. See, also, Bob Lawless, “A Coming Consumer Bankruptcy Tsunami, Wave, or Ripple?” Available at https://www.creditslips.org/creditslips/2020/04/a-coming-consumer-bankruptcy-tsunami-wave-or-ripple.html. ↑
Ben Iverson, “Get in Line: Chapter 11 Restructuring in Crowded Bankruptcy Courts,” Management Science 64 (11), 2018, 4967-5460. ↑
Tal Gross, Matthew Notowidigdo, and Jialan Wang, “Liquidity Constraints and Consumer Bankruptcy: Evidence from Tax Rebates,” Review of Economics and Statistics, 2014, 96(3), 431-443. ↑
See Figure 3 supra and https://www.usa.gov/covid-stimulus-checks. ↑
Tal Gross, Raymond Kluender, Feng Liu, Matthew J. Notowidigdo, and Jialan Wan, “The Economic Consequences of Bankruptcy Reform,” National Bureau of Economic Research Working Paper #26254, 2020. See, also, Michelle White, “Why Don’t More Households File for Bankruptcy?” Journal of Law, Economics, & Organization, 1998, pp. 205-231. ↑