To mark the forty-year anniversary of the Business Law Section’s Mergers & Acquisitions Committee, Lisa Hedrick, chair of the Committee’s Market Trends Subcommittee, reflects on M&A market trend developments in the last forty years.[1]
For more than two decades, the Market Trends Subcommittee of the ABA Mergers and Acquisitions Committee has served as a central resource for practitioners seeking to understand the current “market” status and evolution of deal structures, negotiations, and transaction terms. The Subcommittee’s mission is straightforward but essential: to educate M&A professionals on the latest trends shaping the deal landscape. Through speaker presentations, mock negotiations, open discussion, deal points studies, and market check videos, the Subcommittee has consistently provided members with practical insights into navigating an environment where norms shift quickly and competitive pressures continue to rise.
To understand the changes in the M&A market over the last forty years, Houlihan Lokey, a leading investment bank, provided information from their dataset of transactions over this period. Several themes stand out from a review of their data: the dramatic expansion of global deal volume, the cyclical but upward‑sloping nature of U.S. activity, and the steady rebalancing of buyers as financial sponsors have grown from niche participants to dominant players.
The Rise and Cycles of Global M&A Activity
Global M&A activity has expanded enormously since the mid‑1980s. In 1985, worldwide announced transaction value totaled roughly $240 billion. By 2021, that figure exceeded $5.6 trillion, representing one of the most significant long‑term growth arcs in modern corporate finance. Even accounting for recessions, credit contractions, and geopolitical shocks, the overall trajectory is unmistakably upward.
Global M&A Volume
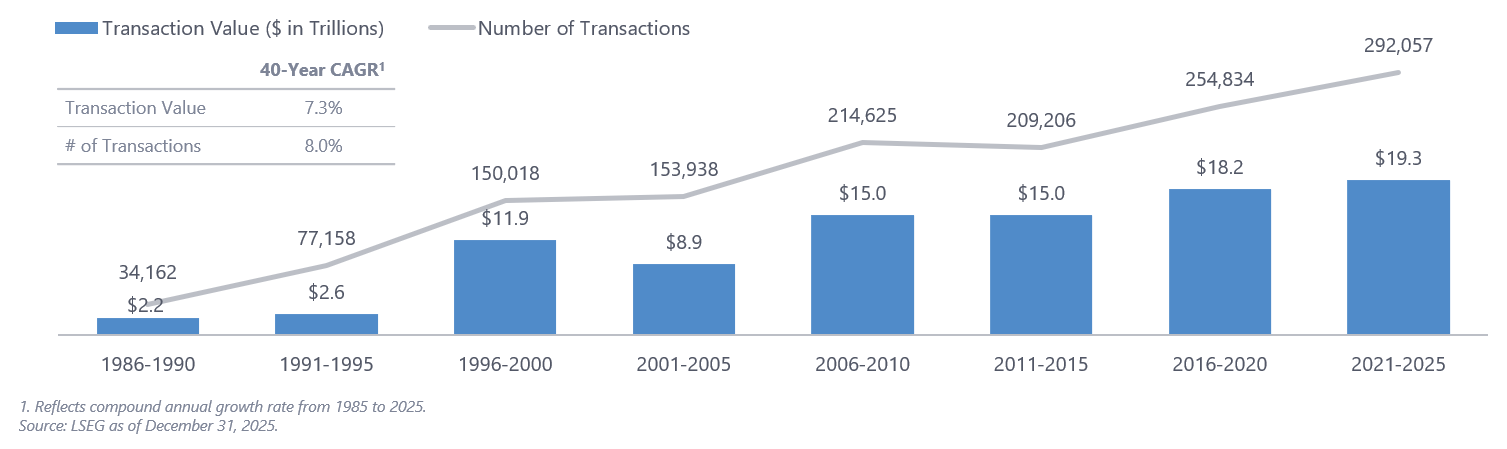
From 1985 to 2025, global M&A transaction value and number of transactions grew by compound annual growth rates of 7.3% and 8%, a dramatic expansion. Source: LSEG as of December 31, 2025.
The data reveal several distinct cycles. The late‑1990s surge reflected the dot‑com boom and cross‑border liberalization. The mid‑2000s peak was fueled by abundant credit and the rise of large‑scale leveraged transactions. The 2008–2009 collapse remains the sharpest contraction in the dataset, followed by a decade of recovery and the unprecedented 2021 spike driven by low interest rates, pent‑up pandemic demand, and record sponsor dry powder.
Yet the most striking feature is not the peaks—it is the resilience. Even after downturns, global deal value consistently rebounds to new highs. This suggests that M&A has become a core strategic tool for corporate growth, not merely a cyclical phenomenon.
U.S. M&A: Cyclical, Concentrated, and Still the Global Anchor
The United States remains the gravitational center of global M&A. U.S. deal value has grown from roughly $200 billion in the mid‑1980s to more than $2.4 trillion in 2021. While the U.S. market mirrors global cycles, its peaks and troughs tend to be more pronounced, reflecting the outsize role of U.S. credit markets and domestic private equity.
U.S. M&A Volume
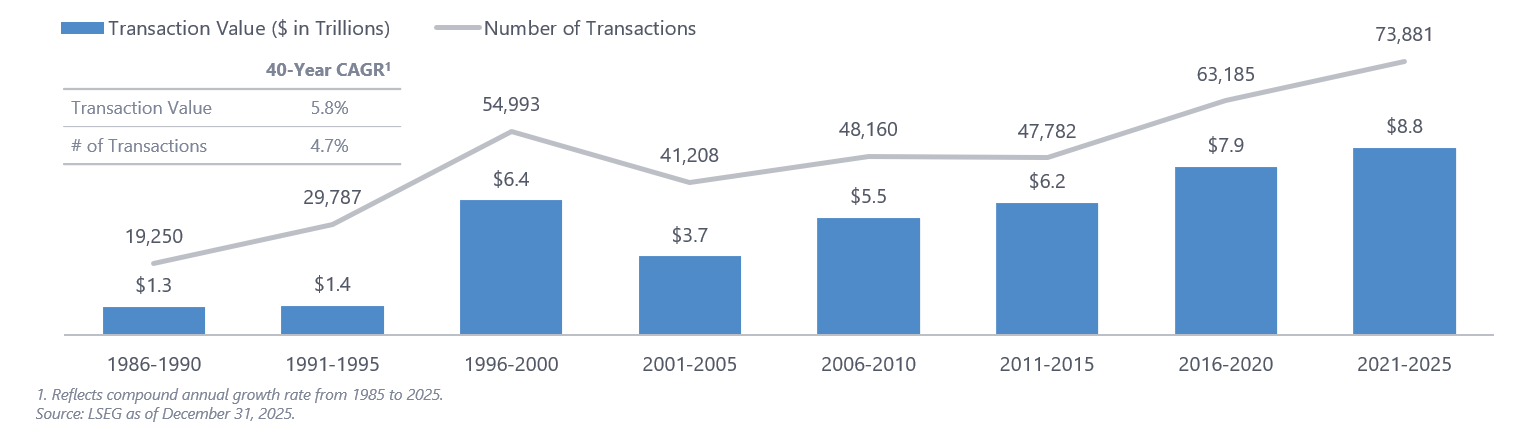
From 1985 to 2025, U.S. M&A transaction value and number of transactions grew by CAGRs of 5.8% and 4.7%, similarly showing long-term growth. Source: LSEG as of December 31, 2025.
The 1990s expansion, the 2006–2007 credit‑fueled boom, the post‑global financial crisis recovery, and the 2021 surge all appear more sharply in the U.S. data. Yet the long‑term trend is consistent: dealmaking has become a central strategic lever for U.S. corporations, particularly in technology, healthcare, and consumer sectors.
Strategic Buyers Still Lead, but Sponsors Have Redefined the Market
Few developments have reshaped the market more profoundly than the rise of private equity. In the 1980s, private equity was still emerging from its leveraged-buyout‑era reputation. Today, it is a central pillar of the global M&A ecosystem.
In the late 1980s, strategic buyers accounted for more than 85 percent of global transaction value. The landscape has shifted dramatically since that time. As private equity matured, institutionalized, and expanded its capital base, sponsors steadily increased their share of global M&A.
Global M&A Activity: Percent Buyer Mix by Total Transaction Value
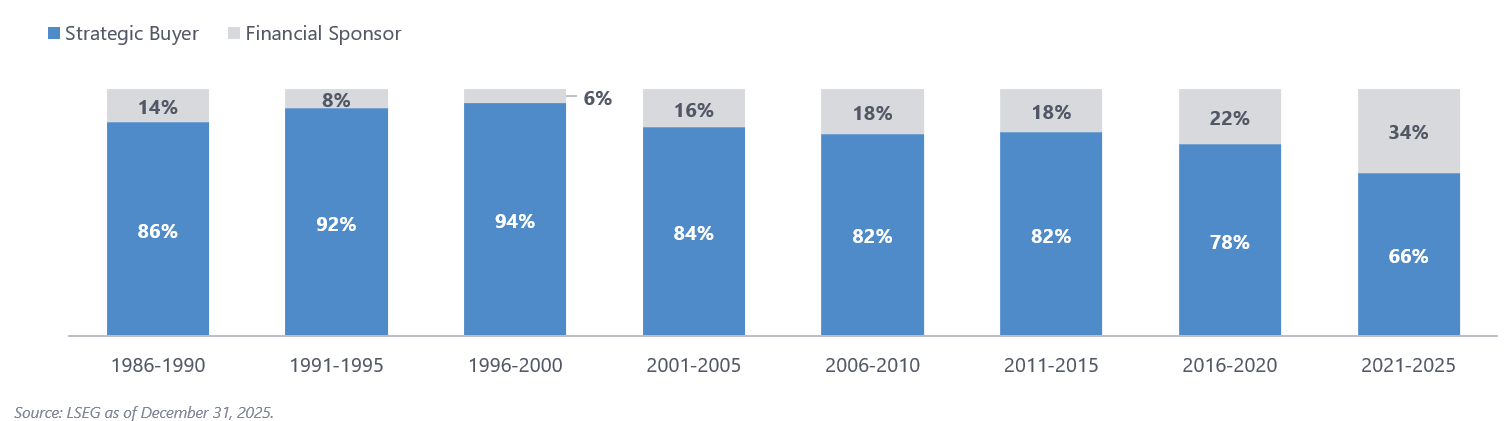
Financial sponsors have more than doubled their share of global M&A, going from 14% of transaction value in 1986–1990 to 34% in 2021–2025. Source: LSEG as of December 31, 2025.
By the 2021–2025 period, strategic buyers represented roughly 66 percent of global deal value, while financial sponsors accounted for 34 percent—more than doubling their relative participation since the 1980s. The U.S. buyer mix tells a similar story to the global data. In the late 1980s, sponsors represented less than 18 percent of U.S. deal value. By 2021–2025, that share had climbed to more than 35 percent.
U.S. M&A Activity: Percent Buyer Mix by Total Transaction Value
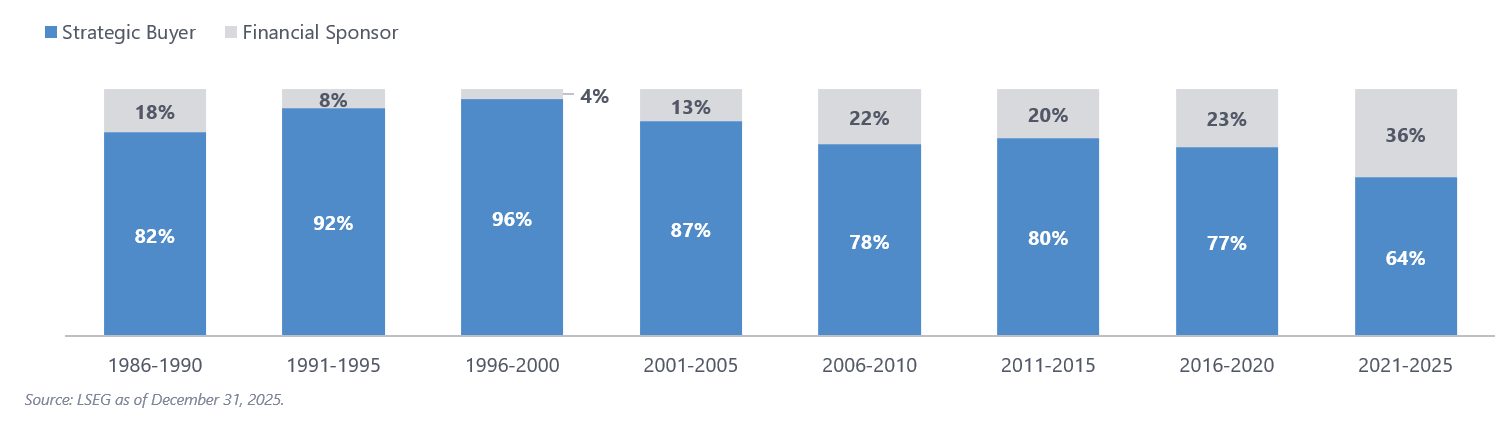
Financial sponsors have similarly increased their share of U.S. M&A, going from 18% of transaction value in 1986–1990 to 36% in 2021–2025. Source: LSEG as of December 31, 2025.
This shift reflects several structural changes:
- Massive capital formation in private equity, with global assets under management surpassing $8 trillion
- Operational sophistication, enabling sponsors to compete directly with strategics for complex assets
- A robust secondary market, allowing sponsors to recycle capital more efficiently
- A shift in corporate behavior, with strategics increasingly disciplined on valuation and integration risk
The result is a more balanced buyer ecosystem, one in which sponsors are no longer opportunistic participants but central actors shaping valuation, auction dynamics, and deal terms.
The Data‑Driven Deal: Technology’s Transformation of M&A Practice
If one theme defines the modern era of M&A, it is the integration of technology into every stage of the deal life cycle. The last forty years have seen a shift from paper data rooms and manual diligence to a highly digitized, analytics‑driven process.
For example, virtual data rooms, introduced in the early 2000s, revolutionized diligence by enabling secure, remote document review. They shortened timelines, expanded bidder pools, and made global auctions feasible. Long gone is the day when buyers were required to travel to a conference room in a law firm’s or accountant’s office to sift through boxes of documents. Now, sellers establish a data room and are able to track which documents are reviewed and for how long by the various bidders. More recently, deal teams have the ability to use machine learning tools to analyze contracts, suggest drafting changes, and evaluate comments from opposing counsel.
Technology has not replaced judgment, but it has fundamentally changed the speed, scope, and precision of M&A execution.
The Emergence and Influence of Deal Points Studies
One of the most important developments in the M&A marketplace over the past two decades has been the rise of deal points studies. These studies have fundamentally changed how practitioners understand market norms, negotiate key provisions, and benchmark deal terms. They have brought empirical rigor to an area that historically relied on anecdote, experience, and negotiation leverage.
The ABA M&A Committee played a pioneering role in this transformation. In 2006, the Committee published its first two deal points studies: (1) the Public Target Deal Points Study, which looked at negotiated terms in public company transactions; and (2) the Private Target Deal Points Study, providing a parallel analysis for private company acquisitions.
These studies were groundbreaking. For the first time, practitioners had access to systematically collected, anonymized data showing how often certain provisions appeared, how they were drafted, and how they evolved over time. Instead of relying on “market practice” as a rhetorical device, deal lawyers could point to actual market data.
Over time, this Subcommittee expanded the studies to include studies focusing on Canadian deals, both private and public; European deals; and carveout transactions.
The ABA’s leadership also catalyzed a broader ecosystem of deal analytics. Today, a wide range of market participants produces their own studies, including investment banks, commercial banks, stockholder representative firms, and insurance providers (particularly in the representation and warranty insurance space), among others.
A Market in Constant Motion
The past forty years have been defined by cycles of innovation, disruption, and reinvention in the M&A marketplace. Increased global M&A volume, the rise of private equity, technological transformation, and the emergence of deal points studies have each left an indelible mark on the practice.
Yet the through‑line across all these developments is adaptability. M&A has always been a forward‑looking discipline that responds quickly to economic shifts, regulatory changes, and new strategic imperatives. As we look ahead to the next forty years, the forces shaping the market will undoubtedly evolve, but the central role of M&A in corporate strategy will remain.
The Market Trends Subcommittee is proud to contribute this reflection as part of the Committee’s fortieth anniversary celebration and looks forward to continuing the conversation at the Spring Meeting.
Lisa thanks Houlihan Lokey for providing analysis of London Stock Exchange Group (“LSEG”) data for this article and also thanks the vice-chairs of the Market Trends Subcommittee—Edward Deibert (Arnold & Porter, San Francisco, CA) and Tatjana Paterno (Bass, Berry & Sims PLC, Nashville, TN)—for their review and helpful comments on earlier drafts. ↑